 English
 Magyar
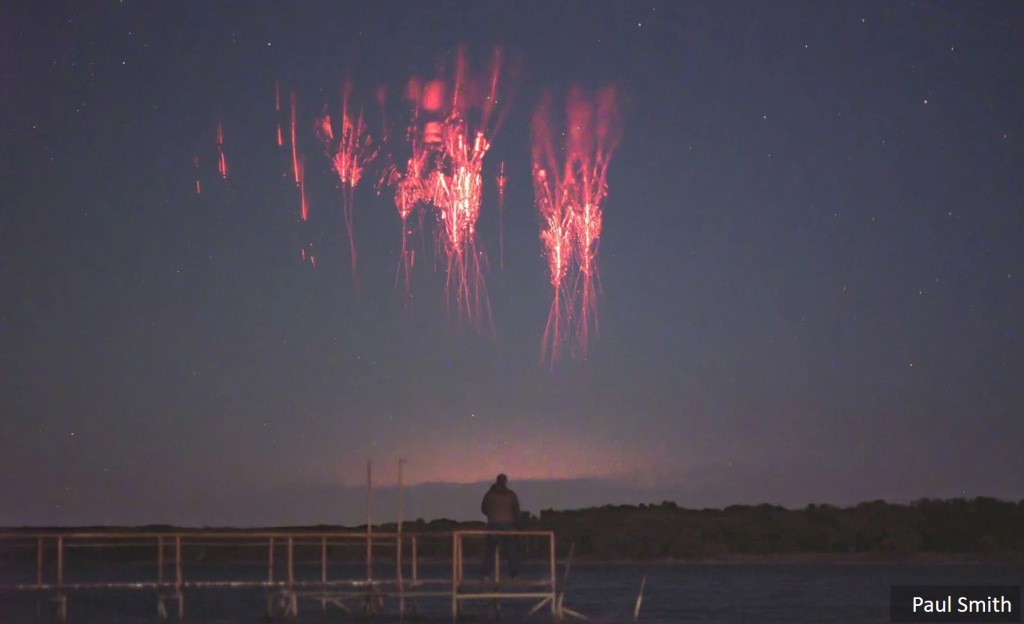
Introduction
Considering both their occurrence frequency and brightness, red sprites are the most likely transient luminous events (TLEs) to be observed. Therefore, the following section primarily focuses on the essential knowledge, considerations, and practical tips for photographing red sprites.
All TLEs, including red sprites, are extremely brief—they appear for less than a second—and while the general direction of the target area can be estimated, the exact location and timing of the phenomenon cannot be predicted. For this reason, it’s unrealistic to expect that one could spot the flash and then aim and trigger the camera in time; by the time you react, the sprite will already be gone.
Instead, the camera must be set up in advance and operated in either continuous shooting or video recording mode. With a bit of luck, one of the photos or video frames may catch the fleeting glow.
For inspiration
In Asia: video compilation showing several types of TLEs by Angel An (Facebook) (Sound on!)
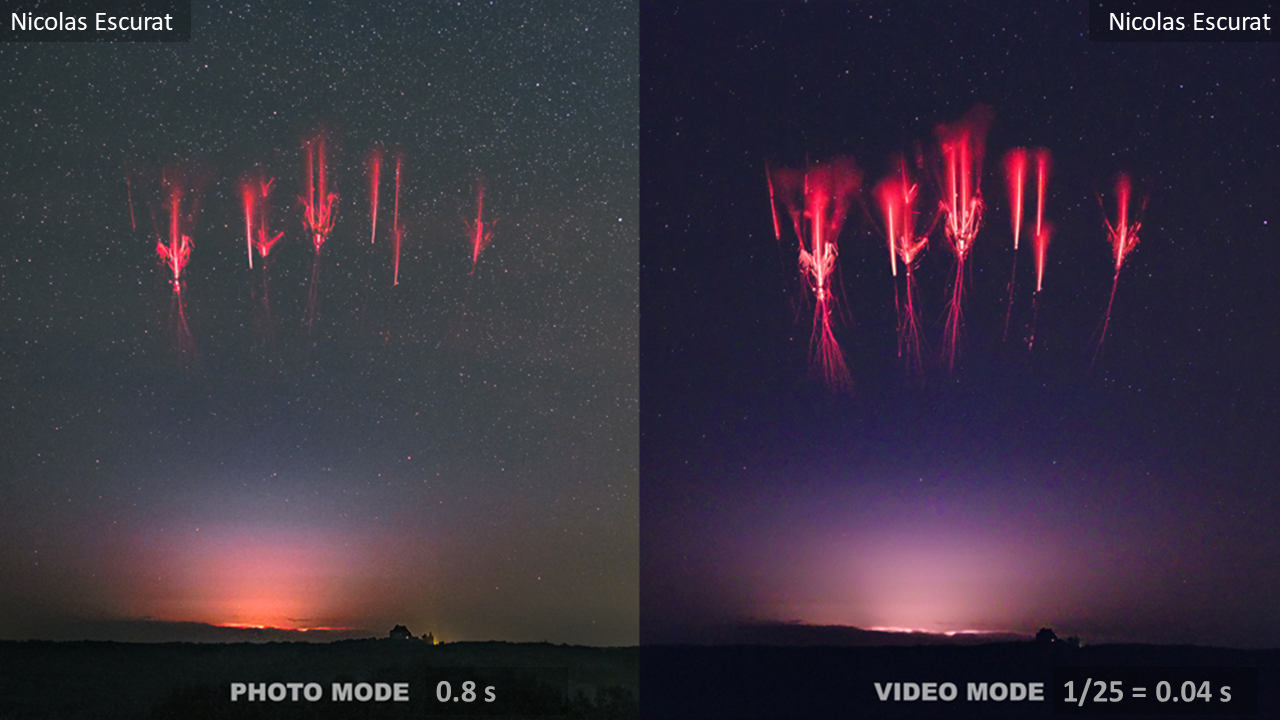
In Europe: video compilation of red sprites observations by Nicolas Escurat (Facebook) (Sound on!)
In North America: The most colorful storm, TLEs & lightning by Paul Smith (Youtube) (Sound on!)
In Australia: Lightning and TLE observations by Nature by JJ (Youtube) (Sound on!)
Camera setup
Is your camera suitable for photographing red sprites? Truly high-quality images of red sprites are best captured using professional cameras. Nowadays, however, even mid-range smartphones, too, might offer a chance to catch a sprite. Such recordings are already suitable for documenting the occurrence of the phenomenon—not to mention the joy of accomplishing the challenge!
Every camera, video camera, mobile phone camera, and camera app, too, has different capabilities. Below, we provide a few general guidelines as a starting point for a potentially successful first observation. The optimal camera settings can be found through experience and persistent experimentation. For mobile phones, detailed information about built-in camera parameters can be found, for example, in the database at https://www.camerafv5.com.
The best way to test your camera’s capability is under a cloudless, clear night sky. For better image quality and to avoid blurring, it’s recommended to mount your device on a tripod or other stable surface. Aim the camera slightly above the visible horizon. In most cases, red sprites can be photographed in such a direction.
You have a good chance of capturing sprites if your camera settings result in photos (or video frames) where not only the brightest stars but also some dimmer ones are clearly visible. While it is not strictly necessary for success, it’s an encouraging sign if your images show stars that are not visible to the naked eye. In addition, the night sky in the image should appear sufficiently dark. In other words, the photo should show a high number of stars and maintain high contrast at the same time.
A few tips related to this:
- On smartphones, it might be worth installing a camera app with more advanced features.
- Set a high image resolution for better detail.
- Turn off the flash.
- Automatic settings (including night mode) don’t always make the most of your camera’s capabilities. Try taking a test shot with auto mode, then compare it with manual settings. In most cases, manual adjustments yield better results.
- Set the focus to infinity. Since sprites occur above cloud level, the events will be far away.
- During your trials, make notes of the settings you use (especially anything different from default) and how many photos you take with each setup. This will make it easier to identify the best-performing settings later, perhaps reviewed on a larger screen. While many settings can be read from the photo’s metadata, keeping written notes is more convenient and provides a clear overview during experimentation.
- The higher the ISO value (sensitivity), the more light the camera can pick up—making dimmer objects like fainter stars visible. This is advantageous for night photography, although higher ISO also results in more image noise (grain). Some noise may be acceptable if it improves your chances of capturing faint sprites. However, too much noise can obscure the actual signal.
- You can also brighten the image without significantly increasing noise by letting in more light. At lower ISO values, use longer exposure times (shutter speeds) to make the image bright enough. For example, with a shutter speed of 1/x, choose a smaller x (i.e. longer exposure). If your camera allows long exposures, you may need several seconds. Be careful, though: if the exposure is too long, the camera will pick up and accumulate scattered background light as well, which can make the image too bright. This reduces contrast and might obscure the sprite’s glow—something to avoid.
- Most cameras offer exposure compensation (EV) settings, which you can increase to +1, +2, etc., to brighten the image if needed.
- Professional cameras or smartphones might offer additional options. One of those worth checking is image stacking (or frame integration), if available. This feature takes multiple consecutive images and combines them into one, reducing noise or allowing both very bright and very dark areas to appear clearly (similarly to the HDR mode). This can help show more stars during nighttime photography. However, we recommend stacking only a few frames—otherwise the resulting image may again become too bright. This is particularly important when hunting for red sprites. It is possible to capture a sprite even with long image stacking, but luck is required. If the sprite appears early in the stacking sequence, the background light collected afterward might wash it out entirely. If it appears near the end, its glow can stand out more sharply against the previously integrated lighter background.
The observation site
From an ideal observation site, you should be able to see the natural horizon in every direction, as if you were standing on the open sea. Such a place could be the rooftop of a building on flat terrain or a high point such as a hill or observation tower.
In practice, however, we often find that the horizon is only fully visible in a few directions. Therefore, it’s worth scouting out several observation sites in your area so that regardless of which direction offers a potential opportunity, you’ll have a location with a good view in that direction.
Even if you can’t see the distant horizon in some directions, you might still be able to see far enough for observation. It’s possible that you’ll have a target that’s still visible from that location. It’s worth assessing from which elevation angle the sky becomes visible in each direction. This lowest angle determines the maximum distance at which you can observe phenomena such as red sprites above thunderstorms.
The elevation angle of the visible horizon can be easily estimated using your own fist. Stretch out your arm in front of you, make a fist, and hold it vertically so that the top of your fist aligns with the horizontal direction. This level line marks an elevation of 0°.

Generate by perchance.org/ai-text-to-image-generator.
Now stack your other outstretched hand’s fist on top of the first—its top indicates roughly 10° of elevation. Every additional fist you stack upward adds about another 10°, so you can estimate the horizon’s elevation by counting fists. This simple method is demonstrated in the following video, where the creator shows how to estimate the Moon’s elevation angle:
A more detailed explanation of how to estimate angles using your hand can be found in this video:
How far can we observe red sprites above thunderstorms in a given direction if, for example, the elevation angle of the horizon in that direction is 10°?
The following table will help you answer that question.
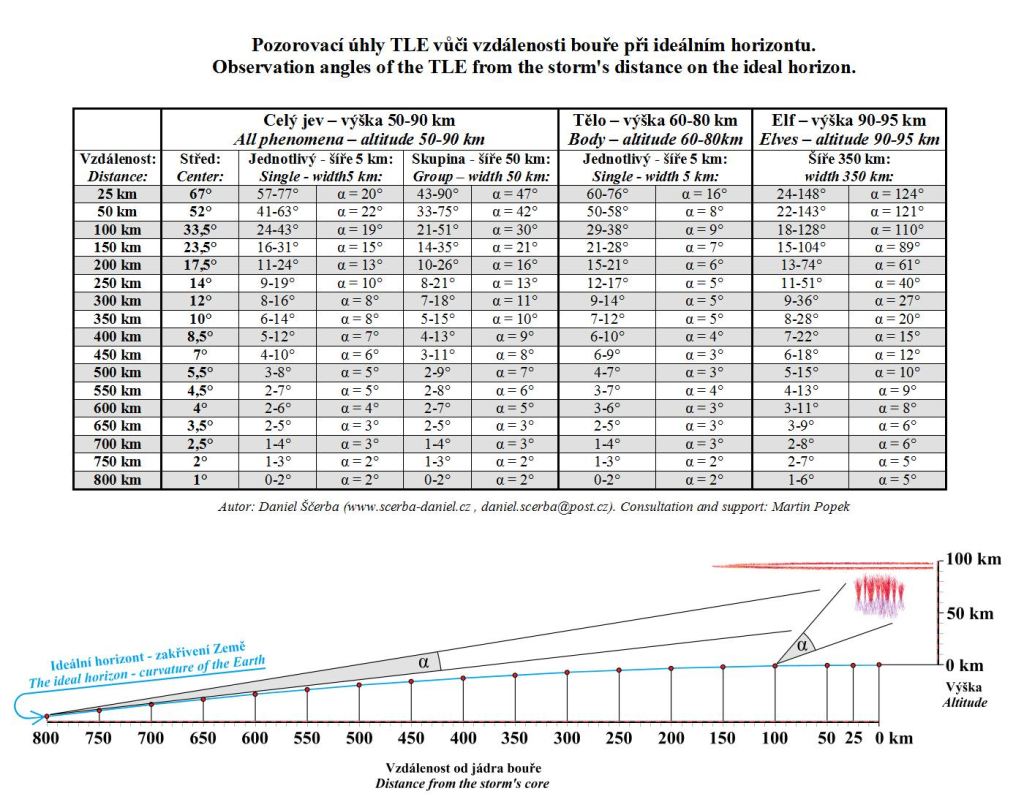
Credit: Daniel Scerba
The 4th column of the 2nd section in the table shows the elevation angle range at which red sprites typically appear depending on the distance of the thunderstorm. If your horizon is at 10°, you’ll only be able to observe sprites that appear above that angle, meaning the entire visible range must be above 10°. This condition is fulfilled if the storm is within 200 km range of your location. If your horizon is at 5°, you can see the full vertical extent typically occupied by sprites even if the storm is 350 km away.
Targeting thunderstorms
Sprites can be triggered by lightning discharges during which significantly more electric charge is redistributed in the cloud than with a typical lightning stroke. This most commonly occurs during cloud-to-ground lightning strokes where a substantial amount of negative charge is transferred from the ground to the upper regions of the thundercloud.
Such lightning events are relatively rare, occurring only a few times per minute globally. They are more common in large, mesoscale thunderstorm systems spanning several hundred kilometers. However, they can occasionally occur in smaller storm cells as well, measuring only a few tens of kilometers across.
As a result, sprites can sometimes appear above smaller storm cells, too, but they are more likely—and more frequently—observed above extensive cloud tops of large thunderstorm systems or squall lines with intense electrical activity and frequent lightning. These are the types of storms we should look for within our observational range, within a radius of 800 to 900 kilometers from our observing location.
The current locations of active thunderstorms can be found on the websites of lightning detection networks.
On meteologix.com, lightning strikes from the past hour can be viewed region by region, with the ability to zoom in on the area of interest. Areas showing frequent and dense lightning activity are the most promising for sprite photography—these are what we should target.
The website lightningmaps.org offers a more user-friendly and visually clear map interface. However, it is based on data from the community-powered network blitzortung.org, and its data coverage and reliability may vary by region. That said, Europe and North America are among the best-covered areas.
Another useful site is windy.com, where lightning activity can be tracked under the “Weather radar”, “Satellite”, and “Radar+” layers. This platform provides many helpful services, although the lightning strokes are not that easy to locate on the map. Under the “Thunderstorms” layer, you can view a lightning frequency heat map and, with a subscription, one can access forecasts in 1-hour increments (or in 3-hour increments without a subscription). This can help assess how long a storm system is expected to remain active and where it might move next.
Once a promising storm system is identified using one of these services, you can estimate its distance more precisely with the help of windy.com. For a rough estimate, enable the latitude and longitude grid under the settings. One degree corresponds to approximately 110 km. For a more accurate measurement, use the “Distance and planning” tool on the website. Click on your observation location, then on the storm location, and the distance between the two points will immediately be displayed at the bottom of the page.
To determine the azimuth (direction from north, counted clockwise) of the storm, several websites are available, such as:
http://cosinekitty.com/compass.html
You’ll need the coordinates of your observation site, which can be copied from the windy.com map by right-clicking. This will be your reference point (Point A) in the azimuth calculator. The coordinates of the storm (Point B) can be obtained similarly. This allows you to calculate the precise azimuth.
Knowing the direction and distance of the thunderstorm will help you determine whether it’s possible to observe sprites above it from your location. If yes, then based on the distance, you can determine the elevation angle range in which sprite flashes are likely to appear. You can then aim your camera or mobile phone accordingly to maximize your chances of a successful capture. The following table will help with this.
Credit: Daniel Scerba
In the first column of the table, you can look up the distance to the thunderstorm, and in the second column, you’ll find the corresponding elevation angle to which you should set your camera. It is advisable to make sure that the field of view of your camera lens actually includes the full elevation range where sprites are expected to appear. This expected angular range is shown in the fourth column of the second section of the table. The lens’s field of view is usually specified in its technical description. For smartphone users, detailed specifications of built-in cameras and lenses can be found, for example, in the https://www.camerafv5.com/ database.
However, even if you’ve found a promising and visible target, clouds in the direction of observation may still block your line of sight. Fortunately, you can assess these conditions even from home. For example, on windy.com, the “Clouds” layer can be used to examine cloud coverage. Infrared (IR) satellite images, which show cloud-top temperatures, can also help determine whether there is cloud cover between the observer and the selected thunderstorm area. On the “Satellite” layer of windy.com, you can view this data going back roughly one hour, and lightning activity can also be displayed. If there are dense intermediate cloud layers, a successful observation is unlikely. However, under partially broken clouds, attempts may still be worthwhile. In fact, many sprite photos have been captured with the phenomena visible through gaps in the clouds or faintly shining through thin cloud layers.
If the IR satellite image shows rapid cooling, expansion, and lightning activity in some parts of the targeted storm, it is likely a developing thunderstorm. The massive lightning discharges responsible for sprite generation can occur throughout any lightning-active phase of a storm, but the largest and most spectacular sprites typically appear during the mature or late stage of a storm’s life cycle. By this time, a large amount of charge may accumulate in the stratiform cloud regions that spread out before, behind, or around the active cells. On weather radar images, these areas typically show moderately high reflectivity (around 30–40 dBZ) at altitudes somewhat lower than the cloud tops of the active convective cells. These regions can be identified easily on windy.com using the “Weather radar” and “Cloud top height” layers. It is often these stratiform cloud regions near active cells where huge cloud-to-ground lightning strokes occur. These are the most frequent parent lightning discharges of sprites. All this means that even if a storm is already well-developed and active, it’s still worth heading out to your observation site—provided you have a clear or at least partially unobstructed view of the sky above the storm.
Observing
At the observation site, you’ll need a compass to orient yourself toward the target direction. It is recommended to use a tripod to keep your recording device stable. The observation window can last from several minutes to even a few hours. Nights, even in summer, can get chilly, so it’s wise to be prepared, especially for more dedicated observers willing to spend more time observing. It’s also practical to have access to meteorological data, so you can follow the storm’s movement during the night, switch to a different target if needed, or conclude your observation once the storm’s activity fades.
Safety is the top priority! We aim to observe luminous phenomena caused by giant lightning discharges, but these lightning strikes also pose a real danger. If the storm is nearby (around 20–30 km) and you hear thunder, you are no longer in a safe location. You should immediately seek shelter in a protected area.
In most cases, however, we aim to record luminous events above distant storms which are not dangerous at the observer’s location.
For scientific evaluation of recorded footage, it is particularly important to have as accurate timing information as possible, along with having the coordinates of the observation site (so-called metadata). Please take a photo or screenshot of a display showing the current GPS time (accurate to at least seconds) and location, including altitude above sea level, either just before or immediately after the observation. Most smartphones have apps that can display this information. Many navigation apps include this feature, but the GPSTest app (or similar) can surely do this. This data makes it easy to calculate any time difference between the internal clock of your recording device and universal time (UTC).
The observation process itself is not complicated, especially if you are well prepared. Apply the appropriate camera settings (for continuous shooting photo mode or video), point it toward the storm according to the correct azimuth and elevation angle, and start recording. From there, just wait. The camera will do the work.
Depending on local conditions, you might need to adjust your camera settings. In humid air, there’s often more scattered light (especially on moonlit nights), so you may need a shorter exposure time. You might also need to adjust ISO, either reducing it to control noise or increasing it slightly to enhance visibility, depending on how the image appears.
Meanwhile, monitor the storm’s movement and activity, and adjust your camera’s direction if necessary.
Even if the storm itself is beyond the horizon and you can’t see the lightning flashes directly, you may still capture high-altitude sprites provided your camera is aimed correctly. If clouds illuminated by storm lightning are visible, and you can also see them on the camera display, this is a good indication that your setup is likely suitable for recording red sprites.
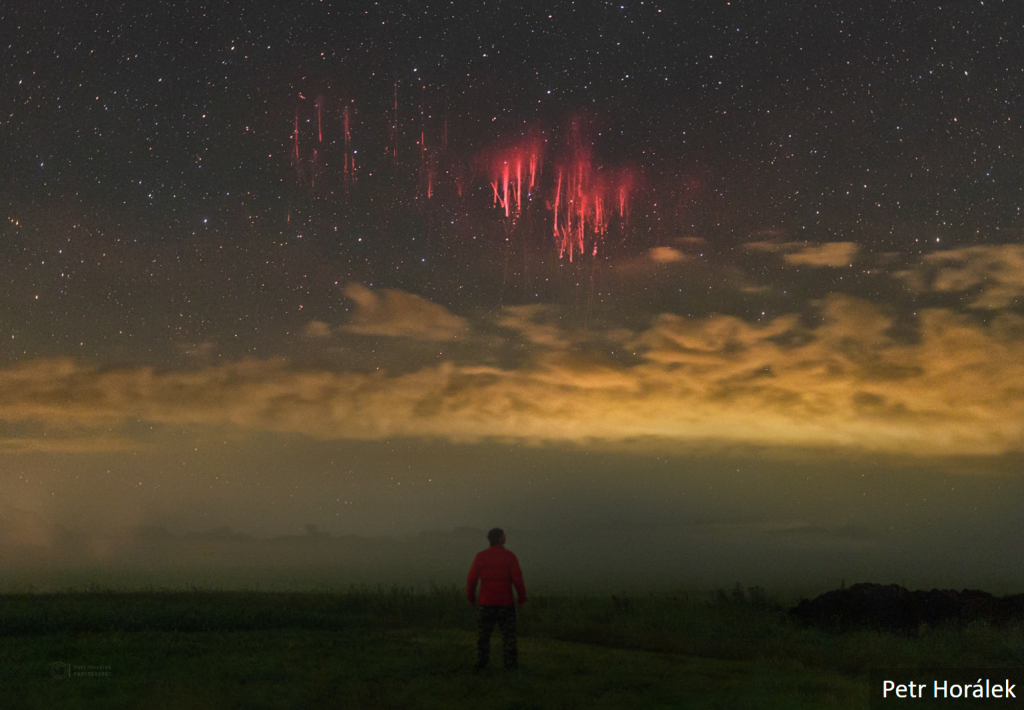
While you wait, you can also try to observe sprites with your own eyes. You’ll need patience, as the exact time and location of these phenomena cannot be predicted. Although the brief red-purple-blue flashes in the dark sky are not easy to notice, once your eyes are fully adapted to the dark, it is not entirely hopeless either. Many observers have already succeeded in spotting them.
We recommend making a short note or log of your observations and impressions already on-site if possible. These can aid in the analysis of your recordings and add personally meaningful and delightful details to your observation experience.
Observing other TLEs
So far, we have mostly discussed considerations relevant to the observation of red sprites. Below, we briefly note how observing some other TLE (Transient Luminous Event) types differs from this approach. (Not much.)
To observe blue emissions (such as blue jets and pixies), it is important to have a clear view of the thundercloud itself, since these phenomena appear at or near the top of the storm cloud. Additionally, blue light is easily scattered in the atmosphere, making it more difficult to photograph such emissions from a large distance. Lightning flashes can be very intense, often drowning out the blue emission. If your goal is to capture blue emissions, you’ll need to set your camera to high sensitivity. Don’t be surprised if the lightning overexposes your footage. If blue emissions do occur, especially pixies, which are very brief and localized, they may only be captured in moments between bright lightning flashes.
The elve is the shortest in duration but also the largest in size among TLE phenomena. Only high-end commercial cameras are capable of capturing them reliably. Due to their massive scale (with diameters up to 200–300 km), it is more likely possible to capture some brighter elves in their full or larger extent over distant storms. However, without digital image enhancement, they are rarely identifiable in the raw footage.
Post processing
In most cases, the bright flashes last for far less than a second, making them difficult to notice and all the easier to miss. Only after thoroughly reviewing the recordings, frame by frame or image by image, can one determine whether the observation attempt was successful. It may be helpful to digitally enhance the video or images to reveal possibly fainter events, too. (However, please always preserve the original files, too, whenever any modifications are made.)
This post-processing stage also requires patience and perseverance, especially when dealing with large datasets from long observing sessions. If you don’t have the capacity to review the raw videos or image sequences captured during the AX4 mission, we are happy to help — just send them to us (see the “Calls for Observations” section).
Sharing
We warmly welcome and appreciate the sharing of TLE-related footage, metadata, and observer experiences with the UHU Project during the AX4 mission (via the “I can contribute!” section) — and also with the broader observer community. You’re encouraged to share in the international observer group “International Observers of Upper-Atmospheric Electric Phenomena” on Facebook (https://www.facebook.com/groups/376355972487572/), or via NASA’s Spritacular initiative (https://spritacular.org/), both of which provide excellent platforms for contribution.
More information
Additional information and resources for observing TLEs can be found online:
Recommendations on the Spritacular website:
https://spritacular.org/blog/how-to-photograph-sprites-78f04a415weciae6
Guide to observing red sprites on the “Science Out There” YouTube channel:
https://www.youtube.com/watch?app=desktop&v=z9BpiQwaSZ8
A guide to observe TLEs by Christophe Suarez:
English: https://webemoi.com/pdf/red-sprites
Español (castellano): https://webemoi.com/pdf/duendes-rojos.pdf
Français: https://webemoi.com/pdf/farfadets.pdf